Dynamic Analysis
IDE Development Course
Andrew Vasilyev
Licensed under CC BY-NC-SA 4.0
Today's Agenda
- Dynamic Analysis
- Performance Profiling
- Memory Profiling
- Test Coverage
Dynamic Analysis
What is Dynamic Analysis?
- Dynamic analysis is the examination of a program’s behavior during execution.
- Key for understanding runtime behavior, performance issues, and bugs.
- It allows for real-time error detection, performance optimization, and ensuring correctness of code.
Static vs Dynamic Analysis
| Aspect | Static Analysis | Dynamic Analysis |
|---|---|---|
| When it's performed | Before program execution | During program execution |
| Error Detection | Can detect potential issues early in the development cycle | Identifies actual issues in real-time as the code executes |
| Performance Analysis | Limited to theoretical assessments | Provides actual performance data |
Dynamic Analysis Methods
- Sampling: Periodic collection of data at set intervals to analyze program behavior.
- Instrumentation: Inserting additional code into the program to collect data during execution.
- Tracing: Recording events or function calls during program execution for later analysis.
- Hooks: Points in code where additional functionality can be inserted to gather data or alter program behavior.
Dynamic Analysis Methods
- Hardware Performance Counters: Measure events like cache misses, branch mispredictions, etc.
- Instruction Set Simulator (ISS):Simulates the behavior of a processor to provide deeper insights into code execution.
Performance Profiling
Performance Profiling

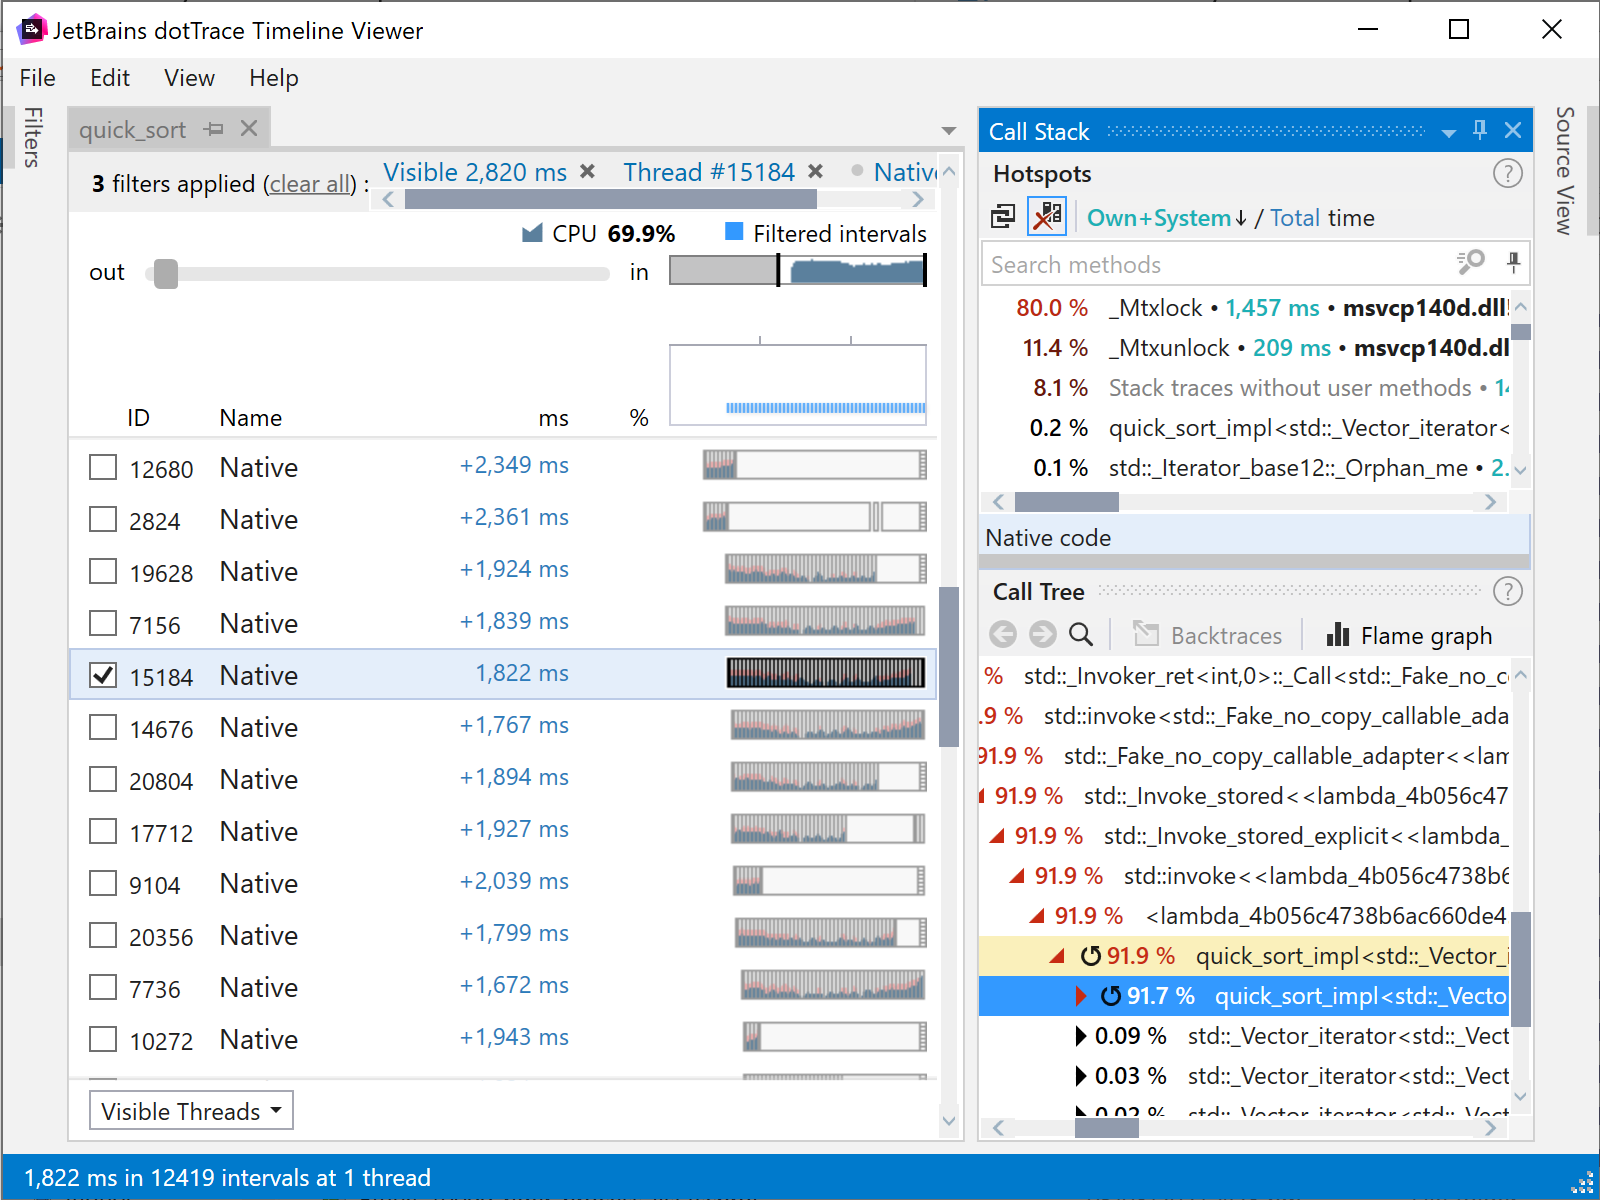
Performance profiling is the process of gathering and analyzing data about the execution of a program to identify areas where it may be optimized for better efficiency and speed.
- Measuring resource usage (CPU, memory, disk I/O, etc.).
- Identifying bottlenecks and performance hotspots.
- Optimizing code to improve overall program performance.
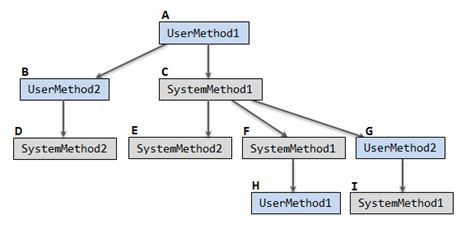
Metrics: Call Graph

- Traces the call journey of functions and methods.
- Helps in understanding the flow of program execution and identifying performance bottlenecks.
Metrics: Execution Time

- Measuring the time taken by functions and procedures to execute.
- Accounting for nested calls and cumulative execution time.
Metrics: Call Counts
- Keeping track of how often procedures are invoked.
- Helpful in identifying frequently called procedures which could be optimized for better performance.
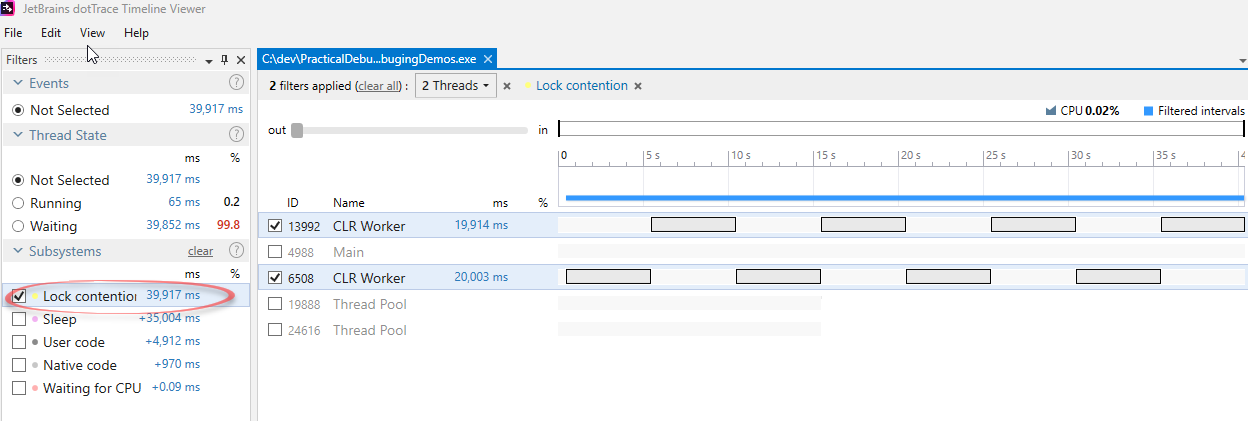
Metrics: Thread Block Time

- Measuring the time threads spend waiting for resource access or at critical sections.
- Key for analyzing and improving multi-threaded program performance.
Metrics: User mode vs Kernel mode Time
- User Mode: Restricted mode for running application code.
- Kernel Mode: Privileged mode for running system code.
Implementation: Sampling
Intermittent processor interruptions for call stack snapshots.
Example: Sampling might involve pausing the program's execution every 100 milliseconds to capture a snapshot of the call stack, which can then be analyzed to understand the code's execution flow and performance characteristics.
Implementation: Instrumentation
Code augmentation for statistics gathering.
Example: Instrumentation involves adding code snippets to record function execution times. For instance, adding timing code to measure the duration of specific functions or methods during program execution.
Implementation: Event Tracing
Event tracing involves capturing detailed events and data during program execution for later analysis.
Example: Event tracing can involve logging every network request made by an application, including details like request and response times. This data can be invaluable for diagnosing network-related performance issues.
Implementation: Performance Counters
Performance counters are mechanisms for collecting real-time data on various system and application performance metrics.
Example: Performance counters can track CPU usage, memory usage, and disk I/O in real-time. For instance, they can help identify CPU bottlenecks when a program is consuming excessive CPU resources.
Memory profiling
What is Memory Profiling?
Memory profiling is the process of monitoring and analyzing a program's memory usage during execution to identify memory-related issues and optimize memory management.
Memory-related issues such as memory leaks, excessive memory consumption, and inefficient memory management can lead to application crashes and degraded performance. Memory profiling helps in detecting and addressing these issues.
Metrics

Memory Footprint: Total memory used by the program.
Memory footprint measurement in memory profiling refers to the assessment of the overall memory consumption by the program. It provides insights into how much RAM the program is actively using during its execution. Monitoring the memory footprint is essential to ensure that the program's memory usage remains within acceptable limits, preventing excessive memory consumption that can lead to performance degradation or crashes.
Metrics
Heap and Stack Usage: Understanding what resides in the heap and stack.
Heap and stack usage analysis in memory profiling involves examining the contents of both the program's heap and stack memory regions. The heap stores dynamically allocated objects and data structures, while the stack is used for function call frames and local variables. Understanding what resides in these memory areas is crucial for optimizing memory management. It helps in identifying if objects are unnecessarily held in memory, leading to potential memory leaks or inefficient memory utilization.
Metrics
Object Dependency: Identifying references preventing garbage collection.
Object dependency analysis in memory profiling focuses on identifying references and relationships between objects in memory. It helps in pinpointing objects that are being held in memory due to references, preventing them from being garbage collected when they are no longer needed. Identifying and resolving these dependencies is crucial for efficient memory management, as it can prevent memory leaks and ensure optimal memory usage.
Metrics
Allocation/Deallocation: Analysis of memory allocation and deallocation patterns.
Analysis of memory allocation and deallocation patterns in memory profiling involves tracking how and when memory is allocated and released during program execution. This provides insights into the program's memory management behavior. Understanding these patterns helps in optimizing memory usage, identifying potential memory fragmentation issues, and ensuring that resources are released properly when they are no longer needed, contributing to efficient memory management.
Implementation: Heap Dumps
Heap dumps are a memory profiling strategy that involves generating detailed snapshots of the objects in the program's heap memory. These snapshots provide a comprehensive view of the objects, their sizes, and their relationships. Heap dumps are valuable for diagnosing memory-related issues, identifying memory leaks, and understanding memory consumption patterns. Developers can use heap dumps to analyze the memory landscape and optimize memory usage effectively.
Implementation: Snapshot Comparison
Snapshot comparison is a memory profiling strategy that involves capturing memory snapshots at different points in the program's execution and comparing them. This technique helps in identifying changes in memory usage over time. By taking snapshots before and after specific program events or at regular intervals, developers can track memory allocation and deallocation patterns. Comparing snapshots can reveal memory leaks, excessive memory consumption, and areas for memory optimization.
Implementation: Object Retention Analysis
Object retention analysis is a memory profiling strategy that focuses on identifying objects that are being retained in memory longer than necessary. Such retained objects can lead to memory leaks and inefficient memory usage. Memory profilers analyze object lifetimes and references to pinpoint objects causing retention issues. Developers can then address these problems by releasing references appropriately or optimizing object management to improve memory efficiency.
Implementation: Instrumentation
Instrumentation is a memory profiling strategy that involves inserting code into the program to collect memory-related data. Developers add instrumentation code to monitor key events such as object creation, destruction, and memory allocations. This code augmentation provides valuable insights into memory usage patterns. Instrumentation can be used to track memory-related metrics and detect memory-related issues, aiding in memory profiling and optimization efforts.
Implementation: Memory Allocation Tracking
Memory allocation tracking is a memory profiling strategy that monitors memory allocation and deallocation events during program execution. By tracking how and when memory is allocated and released, developers gain a comprehensive understanding of memory usage patterns. This information helps in optimizing memory management, identifying potential memory fragmentation issues, and ensuring that resources are released properly when they are no longer needed, contributing to efficient memory usage.
Implementation: Garbage Collection Analysis
Garbage collection analysis is a memory profiling strategy that focuses on assessing how efficiently memory is being reclaimed by the garbage collector. Memory profilers track garbage collection events and measure their impact on memory usage. Analyzing garbage collection behavior helps in optimizing memory management strategies, identifying long pauses caused by garbage collection, and ensuring that memory is reclaimed promptly, contributing to smoother and more efficient program execution.
Test Coverage
What is Test Coverage?

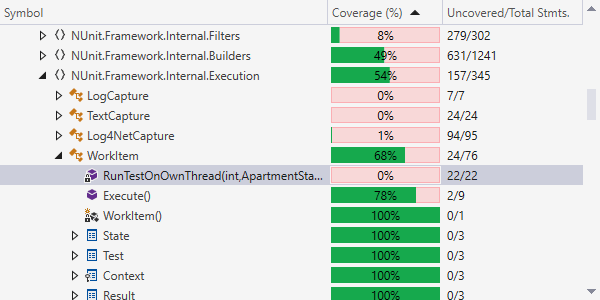
Test coverage is a metric used in software testing to measure the extent to which a set of test cases exercises or covers a software application's code. It quantifies the percentage of code lines, functions, statements, or branches that have been executed by the tests. Test coverage helps assess the thoroughness and effectiveness of the testing process.
Why is Test Coverage Important?
Test coverage is important because it provides insights into the quality and reliability of software. It helps answer questions such as:
- Have all critical parts of the code been tested?
- Is there untested code that might contain bugs?
- Are the test cases comprehensive enough to catch potential issues?
High test coverage increases confidence in the software's correctness and helps in identifying areas that need additional testing or improvement.
Test Coverage Metrics
There are several types of test coverage metrics, including:
- Line Coverage: Measures the percentage of code lines executed by tests.
- Function Coverage: Measures the percentage of functions or methods called by tests.
- Statement Coverage: Measures the percentage of individual statements executed by tests.
- Branch Coverage: Measures the percentage of code branches taken by tests, assessing decisions and conditional logic.
Interpreting Test Coverage Results
Interpreting test coverage results involves analyzing the coverage percentage and understanding its implications:
- High Coverage: A high coverage percentage indicates that a significant portion of the code has been tested. It suggests good test comprehensiveness.
- Low Coverage: A low coverage percentage indicates that a substantial part of the code remains untested. It may signify the presence of unverified code paths and potential issues.
- Targeted Improvements: Identifying areas with low coverage allows teams to focus on writing additional tests for critical code paths.
Test coverage results guide testing efforts and help prioritize testing resources.
Implementation: Instrumentation
The first step in dynamic analysis for test coverage measurement is instrumentation. Instrumentation involves adding code to the program under test to record information about code execution. This added code, often referred to as "probes" or "coverage counters," tracks which parts of the code are executed during test runs. These probes are strategically placed within the code to collect coverage data.
Implementation: Test Execution
After instrumenting the code, the next step is to execute the test suite. During test execution, the probes or coverage counters record data about which code paths are taken. As the tests run, the coverage data accumulates, providing information about the extent to which the code is exercised by the tests.
Implementation: Data Collection
Once the tests are executed, the data collected by the coverage counters is typically stored in a data structure or file. This data includes details about which lines of code, functions, or branches were executed during the test run. The collected data serves as the basis for calculating test coverage metrics.
Implementation: Coverage Analysis
After data collection, coverage analysis is performed to determine the extent of code coverage achieved by the tests. This analysis involves calculating coverage metrics such as line coverage, function coverage, statement coverage, or branch coverage. These metrics indicate the percentage of code exercised by the tests and provide insights into test comprehensiveness.
Implementation: Reporting and Visualization
Dynamic analysis tools often provide reporting and visualization capabilities to present test coverage results in an understandable format. Reports may include coverage percentages, detailed coverage maps, and visual representations of covered and uncovered code paths. These reports help teams assess test coverage and identify areas that require additional testing.
Conclusion
What to read?
- "Dynamic Analysis: Theoretical Developments and Applications" by Felienne Hermans
- "Dynamic Program Analysis and Software Exploitation" by Chris Eagle
- "Dynamic Analysis and Design of Offshore Structures" by Srinivasan Chandrasekaran and S. Rajan
- "Advanced Dynamic Analysis Techniques for Software Testing and Debugging" by Pei Hsia, Ali Mili, and Khaled El-Fakih
Next: Debuggers
In the upcoming section, we will delve into the world of debuggers. Debuggers are essential tools for code analysis and correction. We will explore their roles, features, and implementation insights. Let's embark on this journey to understand how debuggers contribute to the development process.
Questions & Answers
Thank you for your attention!
I'm now open to any questions you might have.